To meet our goal of studying food flows as a basis for understanding the food policy landscape in Halifax, we are aiming for an analysis at a middle-level of detail. We want to know where the city-region’s food comes from and goes to: internationally, inter-provincially, and intra-provincially (i.e., within Nova Scotia, between the Halifax region and the rest of the province).
The data for this type of analysis need to come from a variety of different sources; no comprehensive database of food flows exists in Canada. At least as a first cut, the analysis of food flows for the Halifax region is mainly an exercise in locating the data we need and–because those data come in different formats, units, and levels of detail–puzzling all this together to create an integrated picture.
Detail vs Dynamism
When selecting which data sources to use in modeling food flows, we are sometimes confronted with a trade-off between the level of detail we want and the desire to rely only on sources that can support a dynamic analysis–i.e., sources that are updated periodically (e.g., annually) and standardized across time periods. While it might be possible to obtain fine-grained, localized data on food flows by conducting surveys, interviews or other types of empirical work, the time and expense of doing this on a regular basis will generally be prohibitive. Large, institutional sources such as the Government of Canada (Statistics Canada), the United Nations, and the World Bank often provide rigorously collected and standardized data from primary sources that are otherwise inaccessible (such as individual tax returns or industry sources)–though these data might not provide the level of local detail that is ideal for a reliable analysis.
Stocks and Flows, Supply and Demand
In general, any system can be understood as a collection of resource stocks and flows. Stocks are static: they represent the quantity of a resource within the system at some fixed point in time. Flows are dynamic: they represent the difference between resource stocks between two points in time.
For our target level of detail, we can begin to measure food flows in HRM by integrating two stocks: the supply of food at the beginning of a period and the demand (consumption) of food at the end of that period.
Key Sources
Food Availability (Total Supply)
Statistics Canada publishes a dataset on the annual food available in Canada (kilograms/person) (Table 32-10-0054-01). The annual food available per capita essentially estimates the net flow of food for Canada each year as a combination of domestic production and international trade (imports in and exports out).
These data serve as a foundation for food flow analyses at a finer level
of geographic resolution, such as a province or city-region. If we
assume that the per capita food available in a city-region is
equivalent
to the per capita food available for the country as a whole, we can ask:
what are the various geographic sources of this available food (the
total supply)?
Statistics Canada compiles the food availability data from numerous sources, including industry surveys and other internal data from across the Canadian government. This represents an important source of data on the food supply that would otherwise be nearly impossible to produce for such a wide range of products.
By aggregating Statistics Canada’s food availability data into a dozen or so major food categories (using the “Harmonized System” or HS2 level), we can get a picture of what quantities of these food products are available, on average, to Canadians each year. And by tracking these quantities over time we gain a sense of how those quantities are changing in relationship to one another. For example, the figure below shows the quantities of meat, dairy, vegetables and fruit available in Canada annually since 1971.
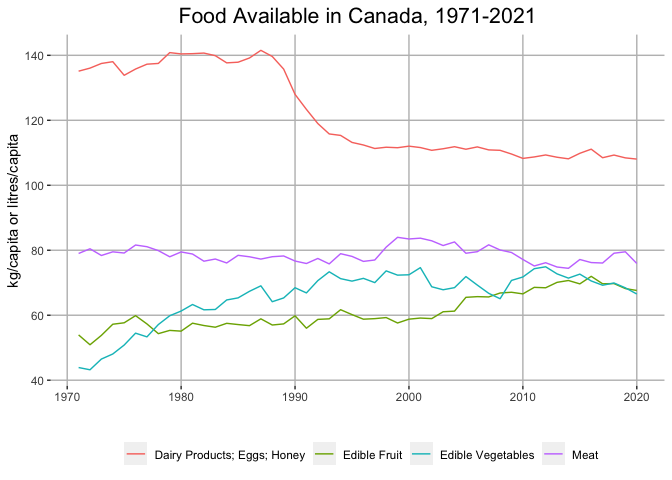
Chart Data Source and Notes
The Harmonized Commodity Description and Coding System (HS System) is used as an international classification standard for commodity trading (statscan2017?). HS codes use a hierarchical classification system, with HS1 being the most aggregated with the least detail and HS6 being the leasy aggregated with the most detail. We coded Statistics Canada’s food availability data using with the corresponding HS6 or HS4-level codes, then aggregated these data further to the HS2 level.
International and Interprovincial Trade Flows
Once we have an sense of the total food supply in a given year, we can begin to estimate which proportion of that supply is attributed to trade flows into the region. As an initial step, we can estimate flows into Nova Scotia from countries outside of Canada (international imports) and from other provinces across the country (interprovincial imports). A further step will be to continue disaggregating these inflows for specific regions within Nova Scotia (i.e., inside and outside HRM).
Data on trade flows come from another key dataset at Statistics Canada: the Supply and Use Tables (SUTs) (Table 36-10-0478-01). The SUTs are part of the foundation of Statistics Canada’s economic statistics programme and trace the supply of commodities domestically along with imports, through to the various uses of those commodities (processing, transportation, consumption, etc). Like the food availability data, the SUT data captures a fairly high level of detail (e.g. apples, grains, milk) and needs to be standardized using the HS System.