Tracking Food Flows
How and why we are looking at these basic dynamics of the regional food system.
Flows in the Food System
One of our projects is to better understand the governance system for food in Atlantic Canada–that is, the landscape of rules and decisions that influence what food gets produced where, how that food moves through the region, and who holds the power to gain access and make choices about food.
What do we need in order to develop this better understanding? The first step is define the system we are trying to understand. Lawmakers and policymakers have conventionally approached their work on environmental and related problems as a process of crafting rules to govern human behaviours that affect the natural world. But this way of thinking is being superseded by a new perspective. Instead of viewing human and natural systems as wholly distinct, and instead of presuming that cause-and-effect works mostly one way (humans shape their environments), thinking in terms of social-ecological systems (SESs) invites us to see these two components as an integrated system–one whose component parts adapt to one another over time.
To put this idea of an SES to work for food policy, we want to assemble and analyze the available empirical data on how food moves (or “flows”) through the regional system. Just as those who study water management emphasize the need for a deep understanding of how physical water sources and flows influence the dynamics of watershed governance, we see a similar need to understand food flows as a basis for mapping regional food governance and identifying opportunities for changes in how collective decisions are made.
We were inspired to start exploring food flows in the Halifax Regional Municipality (HRM) by a recent study from Metro Vancouver that sets out to quantify food consumption and sources of supply for aggregate categories of food (e.g. vegetables, fish, fruits, etc.) in the region. The author of the Metro Vancouver report has generously shared insights from their methodology to get us started on the project. This post describes how we are approaching the HRM food flows analysis and describes some challenges and questions we are confronting as we get started.
Some Initial Questions
What are Food Flows?
Tracking food flows tells us how–and how much–food moves into, out of, and around a regional food system (Moschitz and Frick 2020). It is a way to understand the movements of the “resource units” at the heart of the system. Within any geographic region, some food will be produced, caught, processed, eaten and discarded close to home. Some food produced or caught locally will be sent elsewhere, and other food from elsewhere will be brought in (and, in some cases, sent out again).
We can investigate these food flows at many possible scales. For example, international trade data can tell us what quantity or value of certain foods is imported into and exported from Canada every year. Other sources of data might tell us how much food flows between different provinces and territories, or between smaller units like city-regions. At a very small scale, we might learn how food flows between individual actors like farms, fisheries, grocery stores, farmers markets, hospitals, universities, restaurants and waste disposal facilities.
What Can We Learn From Studying Food Flows?
What a food flow analysis can tell us will depend on (a) our goals and methods for studying them and (b) the available data. Some types of analysis are relatively easy. If our goal is to understand the flow of food imported into and exported from Canada as a whole every year, robust annual international trade data are generally available from reliable sources. These data can generate snapshots of international flows such as this:
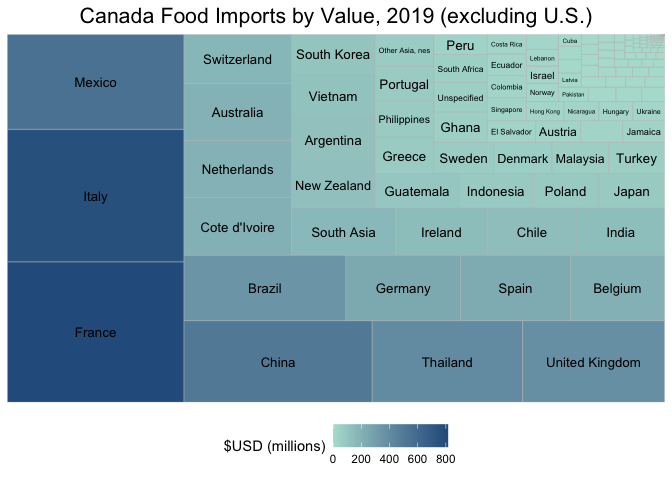
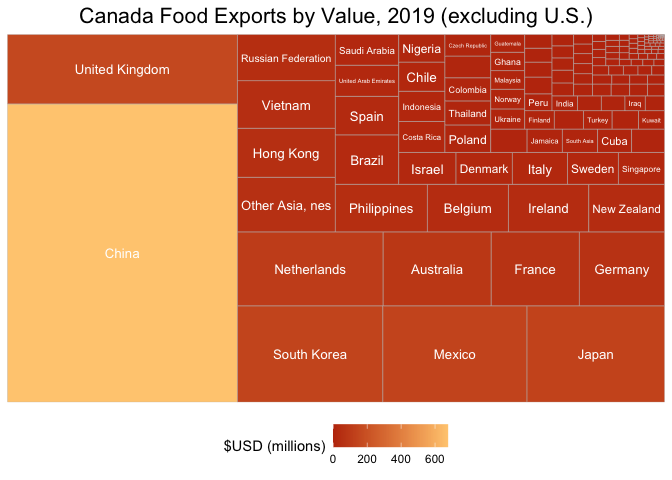
Note: the United States is by far Canada’s largest trading partner in food. More than 60 percent of Canada’s food imports come from the United States, and it is the destination for nearly 85 percent of Canada’s food exports. Because such an overwhelming proportion of Canadian food is traded with the U.S., those flows are excluded from the figures above to make other flows easier to observe.
| Trading Partner | Exports (thousands $USD) | Imports (thousands $USD) |
|---|---|---|
| Afghanistan | 386 | 85 |
| Albania | 34 | 49 |
| Algeria | 618 | 1520 |
| American Samoa | 0 | 0 |
| Andorra | 0 | 2 |
| Angola | 16 | 0 |
| Antigua and Barbuda | 515 | 191 |
| Argentina | 5280 | 121664 |
| Armenia | 2839 | 286 |
| Aruba | 1071 | 1 |
| Australia | 78709 | 200460 |
| Austria | 1243 | 31979 |
| Azerbaijan | 12 | 321 |
| Bahamas, The | 7632 | 1 |
| Bahrain | 1470 | 23 |
| Bangladesh | 2005 | 3679 |
| Barbados | 2602 | 10230 |
| Belarus | 448 | 112 |
| Belgium | 37980 | 203361 |
| Belize | 18 | 337 |
| Benin | 111 | 0 |
| Bermuda | 1327 | 131 |
| Bhutan | 0 | 3 |
| Bolivia | 4 | 2934 |
| Bosnia and Herzegovina | 62 | 91 |
| Brazil | 30893 | 348866 |
| British Virgin Islands | 97 | 12 |
| Bulgaria | 2429 | 5706 |
| Burkina Faso | 24 | 201 |
| Cambodia | 56 | 76 |
| Cameroon | 15 | 74 |
| Cape Verde | 27 | 0 |
| Cayman Islands | 801 | 1 |
| Central African Republic | 0 | 1 |
| Chile | 13280 | 139742 |
| China | 676339 | 503662 |
| Colombia | 10440 | 28138 |
| Congo, Dem. Rep. | 4 | 1 |
| Costa Rica | 14096 | 25124 |
| Cote d’Ivoire | 155 | 203058 |
| Croatia | 2141 | 6650 |
| Cuba | 7840 | 8971 |
| Cyprus | 837 | 367 |
| Czech Republic | 9763 | 12244 |
| Denmark | 17661 | 60021 |
| Djibouti | 0 | 0 |
| Dominican Republic | 1796 | 15854 |
| Ecuador | 1790 | 27826 |
| Egypt, Arab Rep. | 2739 | 13309 |
| El Salvador | 516 | 34015 |
| Equatorial Guinea | 26 | 0 |
| Eritrea | 0 | 0 |
| Estonia | 2174 | 5521 |
| Eswatini | 31 | 40 |
| Ethiopia(excludes Eritrea) | 85 | 1073 |
| Falkland Island | 0 | 0 |
| Fiji | 23 | 4752 |
| Finland | 5358 | 5511 |
| France | 64148 | 815053 |
| French Polynesia | 370 | 1 |
| Gabon | 47 | 0 |
| Gambia, The | 0 | 18 |
| Georgia | 199 | 1355 |
| Germany | 62187 | 247647 |
| Ghana | 6155 | 53359 |
| Greece | 3488 | 70307 |
| Greenland | 16 | 0 |
| Grenada | 275 | 7 |
| Guam | 170 | 0 |
| Guatemala | 5980 | 94981 |
| Guinea | 36 | 1 |
| Guyana | 3461 | 9772 |
| Haiti | 293 | 686 |
| Honduras | 2078 | 4222 |
| Hong Kong | 47272 | 23633 |
| Hungary | 1735 | 21246 |
| Iceland | 2714 | 6385 |
| India | 3721 | 136378 |
| Indonesia | 13769 | 82344 |
| Iran, Islamic Rep. | 1172 | 2961 |
| Iraq | 2966 | 184 |
| Ireland | 37658 | 142237 |
| Israel | 17981 | 17802 |
| Italy | 17304 | 769199 |
| Jamaica | 8121 | 29598 |
| Japan | 130792 | 73908 |
| Jordan | 2205 | 2190 |
| Kazakhstan | 764 | 87 |
| Kenya | 261 | 311 |
| Korea, Dem. Rep. | 0 | 41 |
| Kuwait | 4740 | 13 |
| Kyrgyz Republic | 274 | 0 |
| Lao PDR | 101 | 0 |
| Latvia | 1920 | 10579 |
| Lebanon | 1539 | 17787 |
| Liberia | 8 | 2 |
| Libya | 717 | 0 |
| Lithuania | 1860 | 1615 |
| Luxembourg | 157 | 2255 |
| Macao | 101 | 245 |
| Madagascar | 0 | 424 |
| Malawi | 5 | 438 |
| Malaysia | 6223 | 57967 |
| Mali | 2 | 1824 |
| Malta | 426 | 979 |
| Mauritania | 0 | 5 |
| Mauritius | 84 | 517 |
| Mexico | 136967 | 550675 |
| Moldova | 24 | 3526 |
| Mongolia | 12 | 13 |
| Montenegro | 75 | 150 |
| Montserrat | 7 | 0 |
| Morocco | 447 | 11012 |
| Mozambique | 15 | 4137 |
| Myanmar | 1039 | 20 |
| Namibia | 0 | 0 |
| Nauru | 0 | 0 |
| Nepal | 58 | 888 |
| Netherlands | 106166 | 202220 |
| New Caledonia | 591 | 3 |
| New Zealand | 35578 | 126794 |
| Nicaragua | 629 | 22181 |
| Niger | 0 | 28 |
| Nigeria | 12609 | 8269 |
| North Macedonia | 187 | 5071 |
| Norway | 6582 | 19480 |
| Oman | 916 | 905 |
| Other Asia, nes | 52627 | 61517 |
| Pakistan | 1600 | 14285 |
| Panama | 4025 | 1805 |
| Papua New Guinea | 0 | 439 |
| Paraguay | 101 | 5195 |
| Peru | 4545 | 35361 |
| Philippines | 43142 | 70189 |
| Poland | 12399 | 75206 |
| Portugal | 3722 | 67247 |
| Qatar | 1885 | 1 |
| Romania | 4519 | 2682 |
| Russian Federation | 44669 | 29624 |
| Rwanda | 5 | 7 |
| Saint Maarten (Dutch part) | 572 | 191 |
| Saint Pierre and Miquelon | 1600 | 5949 |
| Saudi Arabia | 19264 | 678 |
| Senegal | 84 | 311 |
| Serbia, FR(Serbia/Montenegro) | 258 | 3039 |
| Sierra Leone | 2558 | 3 |
| Singapore | 14526 | 29509 |
| Slovak Republic | 3753 | 1398 |
| Slovenia | 1324 | 937 |
| Somalia | 0 | 35 |
| South Africa | 8383 | 48890 |
| South Asia | 8110 | 162094 |
| South Korea | 138200 | 107428 |
| Spain | 24070 | 235976 |
| Sri Lanka | 275 | 6777 |
| St. Kitts and Nevis | 689 | 265 |
| St. Lucia | 500 | 182 |
| St. Vincent and the Grenadines | 182 | 14 |
| Sudan | 221 | 15 |
| Suriname | 212 | 1 |
| Sweden | 15979 | 61158 |
| Switzerland | 4766 | 173386 |
| Syrian Arab Republic | 833 | 1176 |
| Tajikistan | 746 | 7 |
| Tanzania | 0 | 964 |
| Thailand | 10841 | 402699 |
| Togo | 4 | 137 |
| Tonga | 0 | 12 |
| Trinidad and Tobago | 9799 | 6715 |
| Tunisia | 806 | 2137 |
| Turkey | 5191 | 57433 |
| Turkmenistan | 0 | 15 |
| Uganda | 9 | 591 |
| Ukraine | 6735 | 20142 |
| United Arab Emirates | 19442 | 5029 |
| United Kingdom | 157572 | 380300 |
| United States | 13127676 | 11931233 |
| United States Minor Outlying I | 92 | 21 |
| Unspecified | 0 | 51586 |
| Uruguay | 933 | 276 |
| Uzbekistan | 1070 | 0 |
| Vanuatu | 0 | 0 |
| Venezuela | 136 | 4112 |
| Vietnam | 45837 | 119282 |
| Yemen | 255 | 0 |
| Zambia | 23 | 243 |
| Zimbabwe | 1 | 2930 |
Other types of analysis are extremely difficult to conduct with any accuracy. If our goal is to understand what proportion of food served in a city’s restaurants is produced and delivered directly from sources within a 100 kilometer radius, such detailed data are unlikely to be readily accessible or easily compiled (though we may be able to develop ways of estimating answers to such questions with a reasonable degree of confidence). Between these extremes there are any number of possibilities and challenges, and other variables–like which foods to include or exclude–will also affect the difficulty and accuracy of the analysis (Moschitz and Frick 2020).
Why Are We Studying Food Flows?
The reason(s) for undertaking an analysis of food flows will shape how we conduct that analysis and what we will learn. There are several possible reasons why we might want to analyze food flows. We might, for example, want to identify strengths and weaknesses in the supply chain for certain foods to assist with emergency or disaster management planning (Schreiber et al. 2021). Or we might want to understand or promote the degree to which food consumed in a region is produced locally, driven by concerns about food access, healthy eating and environmental and economic sustainability (Wertheim-Heck et al. 2018).
So why are we undertaking a study of food flows in HRM? Our aim is unique. We are using food flows to help clarify the policy environment around food in the Halifax Region – to identify and understand the network of collective decisions involved in governing that food system. As we describe in more detail here, policymaking around food increasingly takes place within networks of government, non-government and private actors. Building up a realistic picture of those networks involves tracing the connections between seemingly disconnected issues (like food safety regulation and food waste), complex legal and policy instruments, and different actors working across the system. We can trace (and are tracing) these connections by linking up issues, policies or decision-making forums to one another. But we can only fully understand these networks by also tracing the flow of food (the system’s “resource units”) itself.
For example, some proportion of food consumed in HRM, like in all cities, is sourced from international imports. Studying food flows in the region might tell us what proportion of certain foods are imported internationally (versus inter-provincially and intra-provincially). But, for a coastal city like Halifax, studying international food flows can also reveal who is an important actor in governing the region’s food system. Seeing how much of HRM’s food moves through the Port of Halifax raises the question of how key decisions taken by the Halifax Port Authority (HPA)–a federally regulated Crown corporation–shape or impact the region’s food supply. Putting food flows in this context helps us to situate the HPA in the network of actors and decisions that govern food in the region
Sources Cited
Moschitz, Heidrun, and Rebekka Frick. 2020. “City Food Flow Analysis. A New Method to Study Local Consumption.” Renewable Agriculture and Food Systems 35: 1–13.
Schreiber, Kerstin, Gordon M Hickey, Geneviève S Metson, Brian E Robinson, and Graham K MacDonald. 2021. “Quantifying the Foodshed: A Systematic Review of Urban Food Flow and Local Food Self-Sufficiency Research.” Environmental Research Letters 16 (2): 023003.
Wertheim-Heck, Sigrid, Melika Levelt, Lisa Ten Brug, and Jessica Van Bossum. 2018. Advancing the Evidence Base for Sustainable City-Region Food Systems. MDPI.